House Price Predictor – Web App
Context
For a normal person, willing to buy a real estate property, it is really important to have a rough estimate about current market situation, prices of the properties based on the localities and other factors. This machine learning projects targets to provide the solution to such problems by estimating the price of a house based on the locality, area in sq. feet, number of bedrooms and balcony.
Content
The dataset contains the data about the real-estate properties, which include the information about the flat/house/bungalow based on its location, size, society of which it’s a part of , total sq. feet area and price (in lakhs). Complete list of features and their description is as follows:
area_type : contains the details of what kind of real-estate property is it. For example, Plot area, Built-up area or Super build-up area etc.
availability : This column consists of the date from which the property is available to buy or sell. This column either contains the date or “Ready to Move” comment in the cells.
location : This column contains the data regarding the location of the property.
**size **: This column contains the details about the number of bedrooms in the flat/house
society : This column contains the name of the society the flat/house is a part of.
total_sqft : This column contains the data of the carpet area of the flat/house.
bath : This column contains the details about the number of bathrooms in the flat/house.
balcony : This column contains the details about the number of balconies in the flat/house.
price : This column contains the price of the property in lakhs.
Talking about the shape of the dataset, we have total 9 columns and around 13000 rows.
Exploratory Data Analysis
Exploring the data to know the features, their data types, their impact on the dependent variable, their inter-correlation coefficients and more.
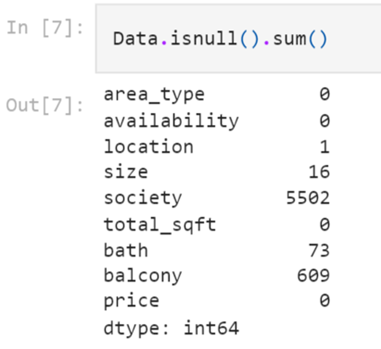
Starting from exploring the null values we get to know that there are few columns with some null values. These can be seen as
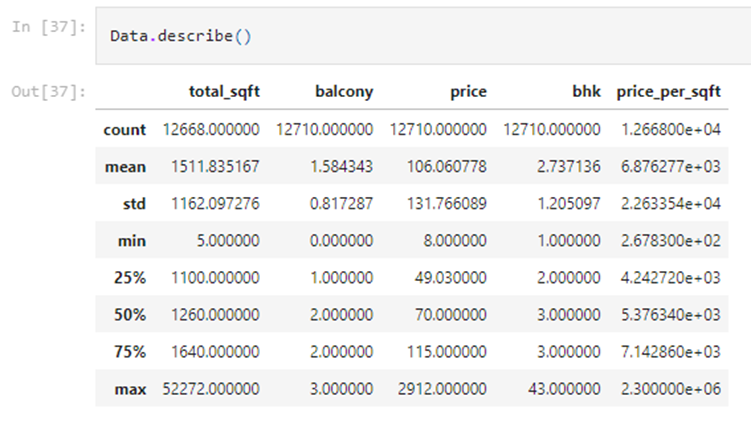
Dropping the features with not a significant impact on our dependent variable and with much higher number or null values i.e. “society” column. Now, the shape of our dataset is reduced to (12710 , 8) The descriptive statistics of our dataset can be seen as below
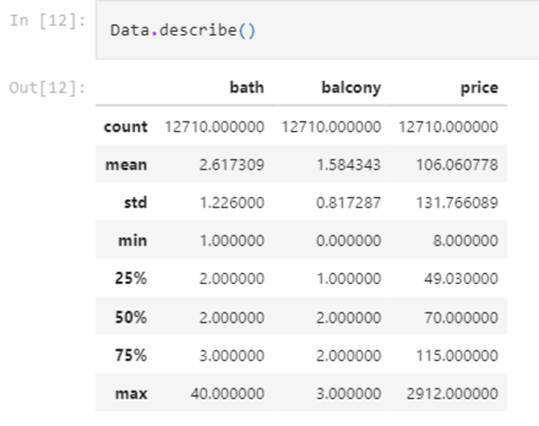
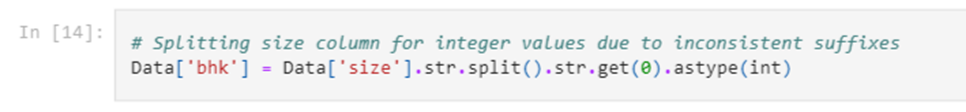
This stats seems fine for now, but we still have some un-consistency in our dataset. Observing the “size” column, the suffixes are not uniform for all the cells. This can create an issue for our ML model and thus need to be treated.
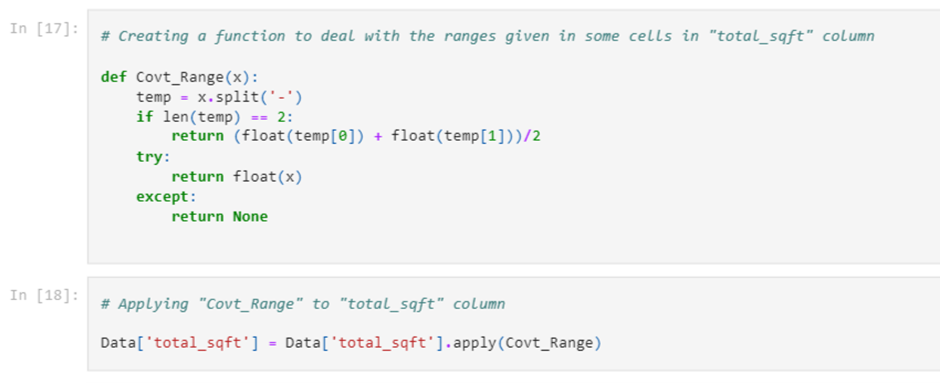
Also, in the “total_sqft” column, some cells have the data in the form of a range. This is not relevant but we cannot remove these cells as these might have very important data in them that contributes to our ML model. This filtering them out and replacing them with the mean of that range can be a good idea.
Now, again removing some unnecessary columns from the dataset which are : “area_type” and “availability”. We need to remove them as these are categorical data and encoding them could have increased the dimensionality of our dataset, plus these are not impacting the price much.
Correlation Analysis
Now, checking for correlation coefficient among the remaining feature to track/find redundancy in our dataset and removing it correspondingly.
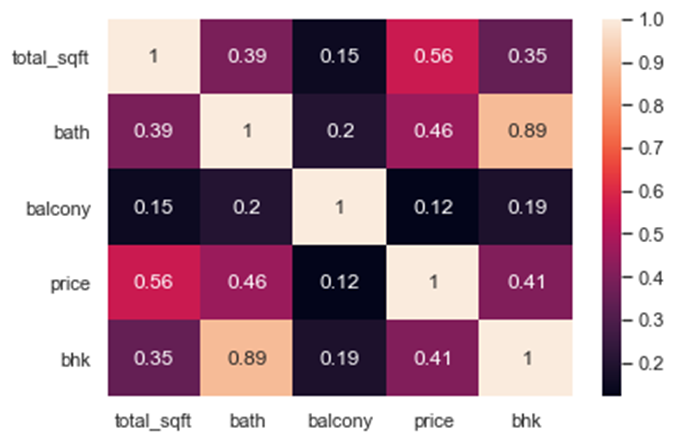
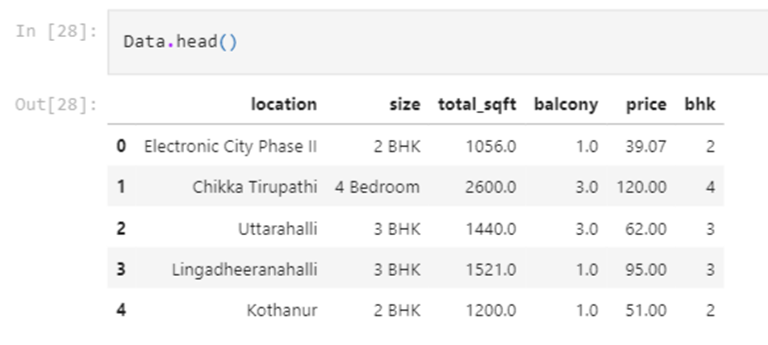
From the correlation heatmap, we can see that column “bhk” and “bath” are highly correlated. To reduce the redundancy of our data we will be removing the “bath” column and keeping the “bhk” column in our dataset. Therefore, our current dataset looks like
Dealing with Outliers
Now, let’s create a new feature named “price_per_sqft”. This is to check for outliers or invalid data in the columns “price” and “total_sqft” After checking the entries in the “price_per_sqft” column and comparing it with the “bhk” column, we have found that some entries are invalid and need to be considered as outliers and treated well The descriptive statistics before removing the outliers and after removing the outliers can be seen as
BEFORE
AFTER
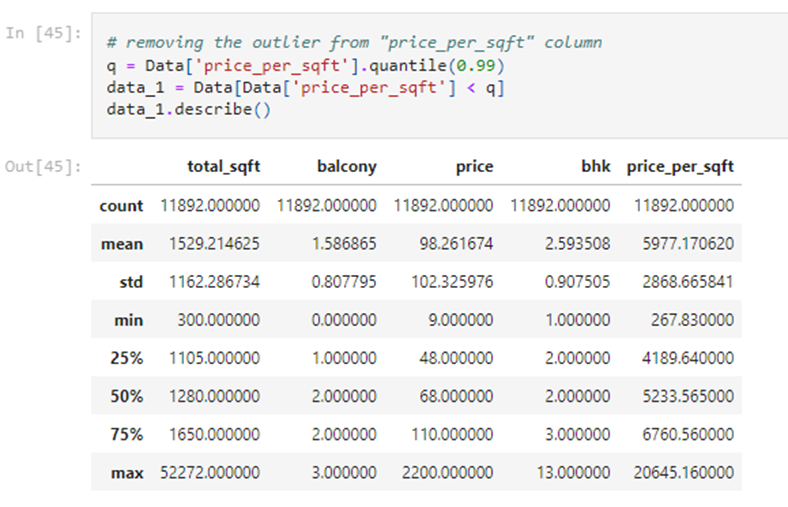
The reason of such a change is descriptive stats after filtering the 99 percentile of our data is because we had some invalid data under “price_per_sqft” column. The invalid data could be detected by uncommon relationship between the “price_per_sqft” and “total_sqft” and “bhk” columns. We also have to remove the outliers from the “bhk” column now.
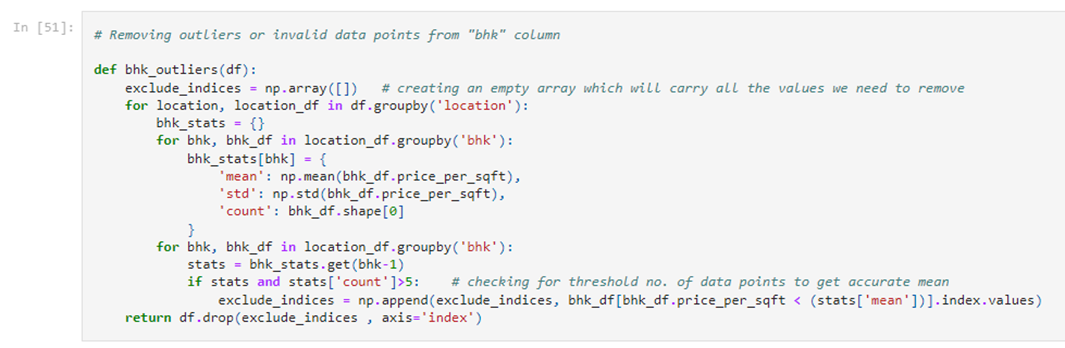
The shape of our dataset now is (8320 , 7)
Model Building
Importing necessary libraries to perform the train-test split on our dataset and then train the Machine learning models. For this project, we have built three models
- Linear Regression
- Lasso
- Ridge
The accuracy scores of all these models are found to be around 71% We finally choose the “Ridge” model because of it accuracy and build our webapp based on this machine learning model.
Building a Flask App
Building the backend of our web based application using the flask framework. Importing all necessary libraries like “flask” , “pandas” , “numpy” and more. Defining a function “predict()”, which take the data on location, number of bedrooms, number of balcony and the carpet area of the house and based on this information, predicts the price of the house in lakhs.
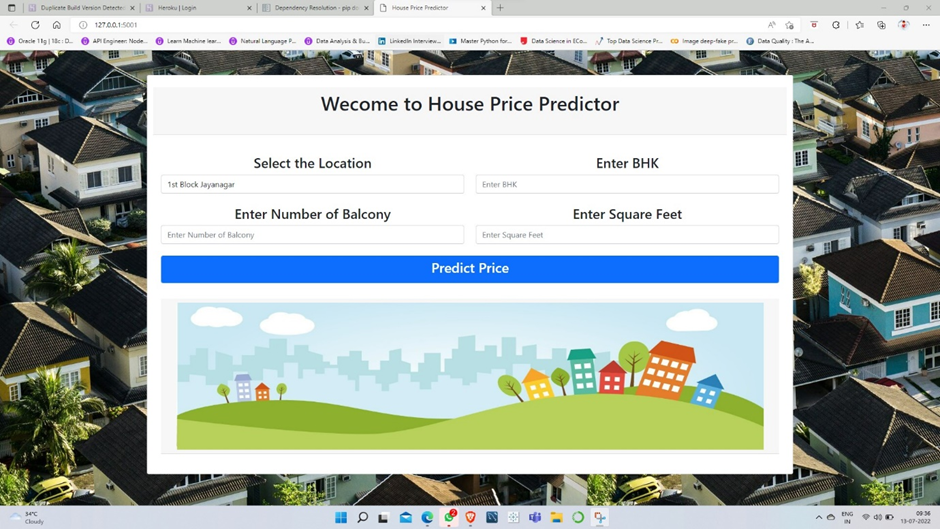
Building the Web Page
Creating the front-end using html and adding some images on the webpage to make it a good looking and attractive webpage to land on and to use. The web app looks like and works like you can see in the video below.
Web App Deployment
I tried deploying the web app on Heroku but it is throwing up some compatibility error. I will be deploying it on AWS cloud server through AWS Elastic Beanstalk and will update the url link to my website here. Till then you can have a look of my web app and understand how it works through this small video.